To work with large wireless networks, there are a sufficient number of good multifunctional software solutions on the market that allow for comprehensive testing of WiFi networks. Often, however, for a quick look at the airwaves during design, deployment, or troubleshooting, you'll find it easier to use a simpler, free toolkit. We present to your attention an overview of the most interesting free programs for diagnosing WiFi networks.
In this article, we will introduce you to nine free software tools - most of them are based on operating systems. Windows systems, others for macOS or Android that will provide you with basic information about existing WiFi signals in the area: SSIDs, signal levels, channels used, MAC addresses, and security types of a particular network. Some of them can detect hidden SSIDs, detect noise levels, or provide statistics on the success and failure of packets sent and received on your wireless connection. One of the solutions includes a WiFi password cracking toolkit, which will be extremely useful for finding vulnerabilities and security assessments when testing your wireless network's hackability.
We also note that most of the tools described below are free versions of commercial solutions distributed by the same vendor, but with reduced functionality.

The Acrylic WiFi Home Wireless LAN Scanner is a stripped-down version of Tarlogic Security's commercial solution. Version 3.1, considered within the framework of this review article, attracts attention, primarily due to the detailing of the wireless environment and advanced graphic capabilities displaying the collected information. The functionality of this solution includes: an overview of the found WiFi networks supporting 802.11 a/b/g/n/ac standards; detection of unauthorized access points and display of connected clients; scanning and analysis of WiFi channels used by wireless networks at frequencies of 2.4 GHz and 5 GHz; plotting the level of the received signal and its power for WiFi access points.
WiFi Scanner for Windows Acrylic WiFi Home will allow you to scan and view available wireless networks in real time, provide information about detected WiFi networks (SSID and BSSID), their type of protection and about wireless devices currently connected to the network, and will also allow you to get a list of WiFi passwords (set by default by manufacturers) thanks to the built-in plugin system.
Being free product, Acrylic WiFi Home 3.1 has a simple yet attractive GUI. A detailed list of SSIDs is located at the top of the application. Here, in particular, you can find: negative values in dBm for the received signal strength indicator (Received Signal Strength Indicator, RSSI), 802.11 standard supported by access points or WiFi routers (including 802.11ac), manufacturer name, model and MAC addresses network devices. The solution recognizes the bandwidth used and displays all the channels used for this. It does not look for hidden SSIDs, but it can show them if it finds network data indicating the presence of hidden networks. The application also has a functionality for inventorying the work of WiFi networks, allowing you to assign and save the names of detected SSIDs and / or clients (for the free version, this feature has quantitative restrictions on use).
At the bottom of the application screen, by default, visual rating information is displayed on the network characteristics of the selected SSID. Also here is a graph of the signal strength and power of all detected access points. When you switch to the advanced mode for displaying the status of wireless networks, you will receive two additional graphics- for the 2.4 GHz and 5 GHz bands, - where both information about the channels used, including those combined into one "wide" channel, and signal level data are simultaneously displayed.
It is extremely inconvenient to export or save the captured data, as the software company decided to cut down this functionality excessively in the free solution: you can copy no more than one line of data to the clipboard and then paste the text into Text Document or spreadsheet. There is also a feature for posting a screenshot to Twitter.
All in all, Acrylic WiFi Home is a good WLAN software scanner, especially since it costs nothing. It collects all the basic information about your wireless space and visually demonstrates the received data, both in text and graphical form, which is great for simple WiFi network diagnostic tasks. The main disadvantage of this solution can be considered big problems with data export, or rather, the actual absence of such an opportunity in view of the functionality cut down by the manufacturer in the free solution.

The AirScout Live app from Greenlee turns your Android smartphone into a handy and portable WiFi network analyzer. AirScout Live has seven modes of operation, four of which can be used completely free of charge without any restrictions for Android devices. The commercial version, unlike the free version, is compatible with most desktop computers(Windows) and mobile devices (Android and iOS). With the help of basic functionality, you can quickly, mobilely and, importantly, free of charge solve problems related to insufficient WiFi signal level in some places of your office or home.
AirScout live will show you all the characteristics of the access points found within range, from signal strength and security protocols to hardware capabilities. It will allow you to determine the least loaded channel, measure the signal strength at each point of the WiFi network and identify places with insufficient signal strength. Help identify sources of interference by analyzing channel usage parameters in the 2.4 GHz and 5 GHz bands. Using the program, you can choose the optimal location for the location of access points in order to provide the highest quality coverage of the premises with a WiFi network and configure it for maximum performance without buying additional equipment. In addition, the AirScout app allows you to take a picture of your WiFi network and save it locally or upload it to the cloud.
AirScout Live is a very easy to use application that does not require any additional training. The user interface looks attractive and intuitive. The first two menu items - "AP Schedule" and "AP Table" - will provide you with clear and comprehensive information about all the characteristics of access points that are in the visibility zone. Access point coverage graphs will visually show you the dependence of the signal level of each of them and the load on the channels in the 2.4 GHz and 5 GHz bands. Extended tabular information about each access point (SSID, Mac address, equipment vendor, channel used, channel width, received signal level in dBm and security settings) are available in the second menu item.
The "Time Graph" item will allow you to see all the access points that your Android device has detected in the monitored location, and their signal level change graph in dBm with reference to time. So, for example, if you are exploring a network that consists of multiple access points, this information will help you understand what the signal strength of each of them will be in a given location, and how the client device will switch between them. In addition, selecting a specific access point highlights its signal strength, which helps visual perception of information.
The “Signal Strength” item will allow you to visually test the signal strength for each access point over time. You can select a specific SSID and see the current, as well as the minimum and maximum signal strength recorded by the device for this access point. The original interpretation of the results obtained in the form of a red-yellow-green speedometer will allow you to visually verify whether this or that function will work in this particular place or not. For example, a stable signal strength in the green zone will tell you that here you will not have problems with resource-intensive technologies such as Voice over IP or Full HD video streaming. Being in the yellow zone will indicate the availability of only web surfing. Well, the red zone will mean big problems with receiving a signal from this access point in this place.
For use additional features, which are not available in the free version of the software without additional hardware (detection of the most common problems: suboptimal signal coverage or incorrect channel selection; identification of sources of interference, including from "non-WiFi" devices; optimization of WiFi network configurations adjacent to networks 802.15.4 standard; tuning WiFi performance by comparing signal strength and usage; Ookla speed test and more) you will need an AirScout controller or a kit that includes a controller and remote clients.
AirScout Live is a great application that, above all, attracts with its mobility. Agree, having a tool that will always be at hand is worth a lot. In the free version of the product, you have access to all the necessary information that you may need to quick analysis the health of small office or home WiFi networks and identify underlying performance issues. Intuitive interface and competent graphic design of the obtained measurement results not only leave a good impression, but also help to speed up the work with the application.

Cain & Abel is a multi-purpose password recovery and cracking application for Windows operating systems, which is also equipped with tools for intercepting and analyzing network traffic, including WiFi networks. Like the previous solution (Acrylic WiFi Home), Cain & Abel is a powerful network analyzer capable of capturing and processing the majority of wireless network traffic.
Its GUI has a relatively ancient, simplified look. The toolbar (the old style with icons at the top of the screen) is used to launch various utilities. Access to the main functional parts of the application is carried out through window tabs.
Through the “Wireless” tab, we get access to functional tools for analyzing the network traffic of WiFi networks. In addition to the usual information about SSIDs and various signal information, you can also find a list and detailed information about connected clients here. For access points and clients, Cain & Abel provides information on the number of detected packets: all packets, WEP Initialization Vector (WEP IV), and ARP requests. Any hidden SSIDs found from the captured packets will be displayed in the GUI. Most of the intercepted statuses and data can be exported to a simple text file.
Despite the huge functional potential of this solution, such shortcomings as the lack of visual graphs, as well as the inability to recognize access points of the 802.11ac standard and determine wider channels, do not allow calling Cain & Abel the best choice for monitoring and analyzing WiFi networks. This solution is worth paying attention to if your tasks go far beyond simple traffic analysis. With it, you can recover passwords for Windows OS, perform attacks to obtain lost credentials, study VoIP data on the network, analyze packet routing, and much more. This is a really powerful tool for system administrator with broad powers.

Ekahau HeatMapper is a mapping software tool for deploying small home-level wireless networks and determining the best location for installing an access point. This is a simplified free version of professional solutions from Ekahau. This software product provides the same network information as the WiFi scanner of wireless networks, but it also generates a WiFi heat map so that you can clearly visualize the signal levels. As part of this review, we will focus on version 1.1.4.
The software offers the possibility of creating a plan or layout of the object being investigated, as well as designing a wireless network topology on a grid for approximate orientation.
The left side of the main UI screen displays a list of wireless networks and their details sorted by signal, channel, SSID, MAC address, and security type. This list includes basic information, but does not include dBm and percentage values. In addition, the application does not recognize networks that support the 802.11ac standard, identifying them as 802.11n.
Using Ekahau HeatMapper, as with other mapping tools, you plot your current location on a map as you walk around a building to generate a heatmap of WiFi coverage. Ekahau HeatMapper will automatically calculate the location of hotspots and place them on the map. Once all the data has been collected, an interactive heat map of WiFi coverage will be generated. So, for example, when you hover over the access point icon, its coverage will be highlighted separately; and hovering over an area of the heatmap will pop up a tooltip for the received signal strength indicator with a negative dBm value for that point.
According to reviews, the Ekahau HeatMapper software solution is an overly simplified WiFi mapping scanner: manufacturers have removed almost all additional functionality from the free version, making this decision really home version. Also, the only option available to export or save is to simply take a screenshot of the map.
However, the Ekahau HeatMapper solution can be used to small networks or to get a basic understanding of how more professional map-based tools work.

The Homedale Software Utility is a relatively simple and portable (no installation required) wireless network scanner for Windows (version 1.75 currently available) and macOS (version 1.03 currently available) with an optional interface command line. In addition to displaying basic information about wireless networks and signals, this utility also supports positioning using GPS and other positioning technologies.
This utility has a simple graphical interface that looks more like a multi-tabbed dialog box than a full-fledged application. The first tab, Adapters, displays a list of all network adapters along with their IP gateways and MAC addresses.
The Access Points tab contains many important information. It does not contain information about the 802.11 standard of each SSID, but here you will find all supported data rates, as well as the numbers of all channels used by each SSID at a given time, including those with a larger channel width. It also does not list hidden networks, but shows other network data that indicates the presence of hidden SSIDs. Also a very useful feature is the ability to save notes for individual SSIDs, which can then be included in any data export.
In the Access Point Signal Graph tab, you will find the change in negative dBm values for the received signal strength over time for all selected SSIDs. The implementation of access to this functionality cannot be called very convenient and intuitive - the choice of wireless networks for monitoring and comparison is done by double-clicking on the desired SSID from the list of the previous "Access Points" tab.
The "Frequency of use" tab illustrates in real time a graphical dependence of the frequencies used by each SSID (for convenience, divided into channels) and signal strength values. The channel usage visualization is displayed for the 2.4 GHz band and each subset of the 5 GHz band. The utility performs its task - it visually demonstrates the busyness of each channel - but it would be more convenient if we could have a single idea of the 5 GHz frequency, instead of dividing it into four separate graphs.
In addition, Homedale offers excellent opportunities, both for free application, to export the collected data. Yes, saving is supported. network list in tabular form in CSV format, logging the results of each scan (useful if you move around during the scan), and saving an image of each graph.
Despite a very simple graphical user interface, the Homedale utility provides more advanced functionality than you might expect from it. In addition, I would like to note the rather impressive, as for a free program, the ability to record and export data, as well as determine the location.

LizardSystems offers a free, non-commercial version of their WiFi Scanner software that has the same features and functionality as their paid product. Version 3.4 of the solution is currently available. In addition to the WiFi scanner, this solution also offers great functionality for analysis and reporting.
The application has a modern graphical interface that is intuitive and easy to use. The Scanner tab provides a list of detected SSIDs. In addition to the standard detailed information, here you will also find signal level values both in negative dBm values and in percentages. It even shows the number of clients that are connected to each SSID. Also, along with the 802.11 standards specification, the solution can detect and report multiple channels used by any SSIDs with a larger channel width.
You can use the list of visible SSIDs to filter input by the following parameters: signal strength, supported 802.11 standard, security types, and used frequency bands. At the bottom of the Scanner tab are graphs that you can switch between. In addition to typical graphs showing signal strength and channels used, visualizations of data rates, channel occupancy and number of clients are also available. The bottom of the screen displays information about the current connection. In the "Advanced Information" tab, you will find various data about network activity, up to the number of unprocessed packets.
The Current Connection tab displays more detailed information about the current wireless connection. This is where you can access and manage the list of wireless network profiles saved in Windows 10, which can be useful as this latest version operating system Windows is no longer given native access to and management of this list. On the "Statistics" tab wireless communication» Graphs and statistics for various types packets, both for the physical (PHY) layer and for the data link (MAC) layer, which will be useful for advanced network analysis.
The LizardSystems WiFi Scanner software solution offers advanced export and reporting capabilities. The basic functionality allows you to save the list of networks in a text file. In addition, you can generate reports summarizing the types of networks found by the scan, with all SSIDs logged, any comments you add, and graph snapshots. These are pretty impressive features for a free WiFi scanner.
Thus, LizardSystems WiFi Scanner really impresses with its functionality, including data output filtering and reporting capabilities, as well as advanced data packet information. It can be an important part of your WiFi maintenance and testing toolkit, but keep in mind that the free license is for personal use only.

NetSpot App is a software solution for researching, analyzing and improving WiFi networks. The commercial version uses a mapping tool for thermal imaging of coverage areas, but this is not available in the free home version. However, this solution is offered, both for operating Windows networks, and macOS. In this review article, we will look at NetSpot Free versions 2.8 is a free, significantly stripped-down version of the company's paid products for home and corporate use.
The NetSpot Discover tab is a WiFi scanner. Despite the simple graphical interface, it has a modern appearance, and the network details of each SSID are displayed in bold and clearly visible. Signal levels are shown in negative dBm values (current, minimum and maximum), as well as in percentage. Hidden networks are not displayed in the free version, and the ability to export data is not supported (although there is such a button, but it is not active).
When you click on the "Details" button at the bottom of the application window, combined graphs of signals and used channels for each WiFi band are displayed, generated for the SSIDs selected from the list of networks. In addition, the signal information of each SSID is displayed in a table view, so you can see the exact values received by the application during each scan.
In general, the free version of NetSpot does a good job of discovering WiFi networks (although it does not support hidden networks). And yet, the free solution has very limited functionality, as we are eloquently told by broken links to a large number of additional features- this is the inaccessibility of visualizations, and the inability to use a heat map, and the lack of export.

WirelessNetView is a small utility from the NirSoft web resource that runs in the background and monitors the activity of the wireless networks around you. It is offered free of charge for personal and commercial purposes. This is a fairly simple WiFi scanner, available in both portable and installable forms. Within the framework of this article, version 1.75 is considered.
The graphical user interface of the WirelessNetView solution is not very fancy - it's just a window with a list of wireless networks. For each detected network, the following information is available: SSID, signal quality at the current time, average signal quality over the entire observation time, detection counter, authentication algorithm, information encryption algorithm, MAC address, RSSI, channel frequency, channel number, etc. .
Thus, signal strength indicators this utility provides negative dBm values, as well as percentages for the last received signal and the average over the entire observation time. But it would be even better if we also had access to the average values for the RSSI of a particular access point over the entire observation period. Another unique piece of available analytics that WirelessNetView offers is how often each SSID is discovered, which can be useful in certain situations.
Double-clicking on any of the detected wireless networks will open a dialog box with all the details about a specific network, which can be very convenient, since your screen is clearly not wide enough to view all the details in the main list. Click right click click on any network from the list allows you to save data for that specific wireless network or all detected networks to text or html files. The Options toolbar menu displays some options and additional functionality such as filtering, MAC address format, and other information display preferences.
Please note that this utility lacks a number of advanced features that we expect to see in modern WiFi scanners. First of all we are talking about the graphical presentation of information, full support for the 802.11ac standard and, accordingly, the recognition of all channels occupied by an access point that can use a large channel width. However, the WirelessNetView solution can still be useful for simply monitoring wireless networks or a small WiFi space, especially if you find some of the unique functionality this utility valuable for themselves.

Beginning with OS X Mountain Lion v10.8.4 and later operating systems, Apple provides the Wireless Diagnostics tool. It is more than just a WiFi scanner; it can help detect and fix WiFi connection problems. But best of all, it's a native toolkit included with the operating system. As part of this review, we will look at the Wireless Diagnostics software solution included in macOS High Sierra (version 10.13).
To get started, press the Option key and then click the Airport/WiFi icon at the top of MacOS. You will have more detailed information about your current WiFi connection, as well as access to the "Wireless Diagnostics" shortcut.
Opening Wireless Diagnostics will launch a wizard called "Assistant" that may ask for additional information such as the make and model of the router and its location. Tests will then run to detect problems. Once validated, a summary of the results will be shown, and clicking on the icon for each result will show expanded details and suggestions.
While not entirely obvious, there are also more tools available to you than just the aforementioned wizard. While the Wizard dialog box is open, clicking the Window button at the top of the toolbar will provide access to additional utilities.
The "Scan" utility is a simple WiFi scanner that shows the usual data about detected wireless networks, as well as short description network types and the best channels. One of its main advantages is that it shows noise levels in WiFi channels, which most of the scanners for Windows OS presented in this article do not show. However, it would be more convenient if all the channels that use specific SSIDs with a larger channel width were listed, and not just the channel width and the center channel were shown.
The Info utility shows the current network connection and detailed detailed information about signal characteristics. The "Logs" utility allows you to configure the WiFi, EAPOL and Bluetooth diagnostic protocols. The Performance utility shows line graphs of the signal and noise, signal quality, and data rate of the current connection. The "Sniffer" utility allows you to capture raw wireless packets, which can then be exported to a third-party packet sniffer.
Thus, the utilities included in the Wireless Diagnostics toolkit for the macOS operating system family are truly impressive, especially when compared to the native wireless diagnostics toolkit for Windows operating systems. You always have a WiFi scanner at hand (which even shows noise levels) and a packet capture option (followed by the ability to export), and their troubleshooting "Assistant" seems really smart. However, for the visualization of WiFi channels, in our opinion, there is not enough channel usage graph.
In addition, Apple offers an excellent tour and guide to using Wireless Diagnostics for more information.
Each of the diagnostic programs we have reviewed WiFi networks has its advantages and disadvantages. At the same time, all these solutions, judging by user reviews, are worthy of being downloaded and evaluated in action. The choice of the optimal program for each specific case will be different. So try it!
A modern router is able to perform a scan, check if the channel is free, or fix an excess signal. You can easily find a free window. Often the router firmware needs to be updated. Be careful! Loss of power will interrupt the update process - instead of a Wi-Fi channel scanner, you will get a pile of scrap metal. A wireless access point will be restored only by an official service center, or by a technically enlightened Kulibin.
External interference reduces the speed of information passing. The bitrate drops noticeably. Try to place the router next to a working microwave oven - miracles will begin immediately. Interference is created by telephones, the Sun, industrial, military facilities. Even USB interface 3 is a little phony.
The channel scanner shows a list of available SSIDs, ignoring extraneous factors. Therefore, even a visually free niche sometimes works poorly. Consider software features when building a home network.
If you notice a significant decrease in speed, use shielding, install directional antennas. Avoid crossing the beam line with your body. Microwave radiation is extremely harmful, it is perfectly absorbed by the body's aquatic environments. Memory, intelligence, blood counts worsen, sleep is disturbed. Immunity drops.
Even the 300th TP-Link series is able to recognize network congestion. The updated firmware works wonders. Iron itself begins to look for free channels, choosing (even automatically) free bands. The screen will show amazing things: the neighbors literally occupied the same rooms. The smart device will monitor, show the status of the networks for user to check.
The screenshot clearly demonstrates the above. If the neighbors bothered to update the firmware regularly, a check with the analyzer would show a fundamentally different picture.
The TP-Link firmware update option is the best. You immediately get a ready-made tool for monitoring frequencies. Of course, the router is able to check only its own operating range (2.4; 5; 60 GHz).
The range of information is very different. Choose a file by carefully examining the label. If the latter is missing, wait a little to despair. Versions of hardware, firmware are often indicated by the admin panel. Avoid arbitrariness: an experimental test can kill equipment.
The software refresh procedure will require access. We believe that setting up the router itself is as simple as possible. As a last resort, do hard reset equipment by pressing the appropriate button.

Software that can determine the load density of Wi-Fi channels is widely known. The strange name inSSIDer implies the ability of the device to catch SSIDs surfing the air. Replacing the aging NetStumbler will please mostly Windows users.
The utility will get the user:
Attention! The utility is powerless to track interference from household appliances, broadcasting, mobile phones, Bluetooth.
Considering what has been said, Android users breathed a sigh of relief: they will have to unambiguously sort through the channel numbers with handles. However, there is another option. Yes! Acrylic WiFi (acrylicwifi.com/). The novelty is still free, have time to download.

The utility collects:
Download the right software:
Note! In December 2017, Kaspersky unveiled a number of applications (official stores) that carry a threat. Therefore, it is better to use router firmware.

Use Fing - Network Scanner. iOS owners just need to visit the AppStore.
The article deals with free software(software) under control Microsoft Windows, which allows to make a preliminary analysis of the radio coverage of the territory for the presence of third-party equipment operating in the 2.4/5 GHz Wi-Fi band. Comparison made technical features the software in question.
In wireless networks, the communication channel between the transmitter and receiver is open, which greatly complicates the analysis of radio signal propagation in the territory of the network being designed. And even more annoying is that neighboring wireless equipment through this "open" channel can have a negative impact on your network. Therefore, radio survey of the territory plays a very important role in the design of a Wi-Fi network. Some experts claim that a radio survey is a completely unnecessary stage, referring to the fact that surrounding networks are also constantly appearing, developing, modernizing, transferring, etc. But you must admit, it’s better to know in advance that a giant network of points lives near you access to a neighboring office, and take appropriate measures (for example, move to other non-overlapping frequency channels), rather than later encounter radio wave interference problems and, as a result, low throughput your "open" communication channel.
To date, there is a sufficient amount of software that allows you to assess the level of the ambient electromagnetic background in the 2.4/5 GHz bands. This article discusses programs running under OS Windows.
Acrylic Wi-Fi - the newest free network scanner, which displays the available wireless networks, their specifications(protocol, channel, maximum speed, etc.) as well as information about their protection level. The program even includes a list wifi passwords, which are used by default access points.
Acrylic has a paid professional version with advanced features to detect wireless security issues. Also in this version, the program performs a radio survey of the territory and offers to select the optimal channels in the network to ensure the most correct operation. The appearance of the program is shown in Figure 1:
Figure 1 - Appearance of the Acrylic Wi-Fi program
In the free version of the program, its capabilities remain rather scarce, limited to the output of the information shown in the screenshot above (Figure 1), namely: transmitted access point - SSID; her MAC address; RSSI - signal level; Chan - number of the channel used for transmission; 802.11x - Wi-Fi transmission standard; Max Speed - maximum speed; WEP/WPA/PWA2 - Encryption type. An excellent feature is that the program shows on which access points WPS 1.0 / 2.0 is enabled, because it is no secret to anyone that this WPS 1.0 has long been a kind of "back door" for any network. It also displays related information about the manufacturer (Vendor) and the type of network in which the access point operates (Type), or in other words: does it have access to the Internet, or does it make no sense to break it (just kidding). For more pathos, a graph is displayed showing changes in the signal level from various access points over time (lower right in Figure 1).
In general, the listed set of functions is limited to the free version of Acrylic Wi-Fi. Pretty meager, given that long before this program, software appeared that could do more.
It’s hard to find fault with the professional version of the program, they stuffed quite a lot there useful features, for example, the program itself will indicate access points that negatively affect your network. Acrylic allows you to generate status reports WiFi networks with detailed characteristics of access points and transfer them to the communicator or administrator's computer.
Resume on acrylic wifi: when working with this program, there was a feeling that it was made entirely on the platform Kali Linux with the only difference that it is doped graphical shell to work from under Windows. The paid version is complemented by the fact that it allows you to generate reports in HTML format and helps the user make decisions about network settings without going into technical nuances. Thus, I would rate the free version of the program at three points on a five-point scale, it can be classified as software for "beginners", the paid version of the program deserves a slightly higher rating of three plus (due to report generation). However, in general, the program remains weak in terms of its technical capabilities. In addition, it contains a bunch of distracting links leading to the developer's website and profiles on google+, Facebook, twitter, etc. What generally creates the impression is not about technical application, but about the program for entertainment, when, having nothing to do, I decided to "monitor" neighboring Wi-Fi access points.
This software can show detailed information about 802.11 a/b/g/n/ac networks near you, as well as access point parameters and signal strength. The program also has a paid and free version, unlike the previous software, they do not differ in functionality. After installing the program, you can use it for 30 days, after which you need to register it - free of charge for personal use, or buy - in case of commercial use of the software. The appearance of the program is shown in Figure 2.

Figure 2 - Appearance of the Wi-Fi Scanner program
As in the previous software, information about available networks is displayed in the main column, but the information is more extended. The presence of additional columns: Achievable rate - the actually achievable data transfer rate, Channel Width - the channel width used, Spatial stream - spatial streams (here we are talking about MIMO technology), Channel Utilization - how busy the data transfer channel is, and more extended information about the security protocols used , and specifically - the type of encryption: CCMP / TKIP / WEP / or a combination of them.
In the free version of this program, all the functions listed in the professional version of Acrylic Wi-Fi are available. In particular: Figure 3 shows a graph of the signal strength from available Wi-Fi networks. Very convenient and intuitive.

Figure 3
Figure 4 provides extended information about one of the surrounding networks. IN this case this network with the same name Rostelecom.

Figure 4
Resume on WiFi Scanner: In my opinion, the design of this program is quite "light" in terms of the perception of the displayed information, and the location of all buttons and tabs is intuitive. This program is an excellent solution for private use, and for commercial use, the prices are reasonable. The program deserves an excellent rating.
Belongs to the class of "weak". From a technical point of view, the program has glitches and shortcomings, but it works on latest versions Windows. The program is easy to use, but only allows you to evaluate the signal level coming from the access point, and some information already listed in previous software products. The program does not see hardware manufacturers and does not always determine the model of the access point whose network it has detected. Moreover, the signal strength from the access point is also not always able to determine. The appearance of the main program window is shown in Figure 5.

Figure 5
The program does not provide filters in any way, therefore, for example, on the power distribution graph of available access points by channels, it is impossible to remove connections that are “uninteresting” for us, so it simply shows such uninformative stuffing (Figure 6):

Figure 6
Given the incomplete performance of this program, it is assessed, to put it mildly, "unsatisfactorily." The program is rather weak compared to other similar free software distributed throughout the Internet.
Add to list outdated programs there are those that either do not support the "modern" Wi-Fi standards - IEEE 802.11n / ac, or no longer work under Windows 7/8/8.1/10. And the appearance of these programs is rather depressing, which is not pleasing to the eye.
Network Stumbler is a lightweight wireless network monitoring tool for Windows. Its development stopped at the support of 802.11 a / b / g standards, that is, it monitors the network only in the 2.4 range, excluding five gigahertz. The software works on Microsoft Windows systems up to XP inclusive.
WirelessNetView was once a great tool for monitoring Wi-Fi networks, but is now somewhat outdated.
Wireless Network Watcher - originally created to detect and analyze Wi-Fi networks. I once used it myself, the utility scanned local networks, including wireless. The program displays a list of all devices currently connected to the scanned network. The device information output table contains such information as: IP, MAC address, device name and adapter manufacturer. The list can be exported to HTML. On the issue of analyzing Wi-Fi networks, her attitude is rather mediocre, because in order to get information about a Wi-Fi network, you need to connect to it. In this review, she got in fact simply because of her specific name.
The Acrylic Wi-Fi and Wi-Fi Scanner programs listed above belong to the class of those free programs that keep up with the times and are able to monitor access points operating on the relatively recent IEEE 802.11ac. In addition to the programs considered, there are also no less famous ones that were not included in this review, among which inSSIDer is a completely and completely paid software recently. In addition, a large number of programs running Os Android, Mac Os and Linux are available on the network. But that is another story.
wifi analyzer simple essential tool when sometimes in everyday life, when using Wi-Fi networks, the most stable access point that shows best coverage, gives not the most stable Internet. To easily identify wi-fi hotspots access giving a stable Internet, without any interference - you need a wi-fi analyzer, which will be discussed in this article.
wifi analyzer- a program or device that scans, analyzes the network; as if Captain Evidence tells us. The goals and implementation of such an analysis can be very different from finding a cleaner channel to Aircrack-ng methods, which is highly desirable to consider when looking for a wifi scanner. Nevertheless, speaking of an analyzer, they mean a tool for building a coverage map, analyzing channel distribution, analyzing interference and signal level, excluding traffic analysis tools like Wireshark, Aircrack, tcpdump, they are still a slightly different direction, although they can also be used in interference analysis if ask.
To put it simply, a wifi analyzer is a program to see why Wi-Fi is not “driving”.
 This class of tools is needed to observe the mutual influence of radio devices in the centimeter range, which is any equipment that can wi-fi, or speaking plain language in order to see in real time not only who is to blame, but also what to do, to restore a stable connection in the sense of where and how to bring down, yeah, a kind of tractor of Peter the pig.
Wi-fi analysis is a common and necessary task when setting up, diagnosing, restoring and hacking a network. Naturally, depending on the task, the aspects of analysis are different, if during setup and diagnostics the physical properties of the channel (frequency, field influence, channel occupancy) are more interesting, then when hacking, more attention is paid to logic (protection, encryption, etc.).
The task is so important that for devices like Ubiquiti NanoStation, the release of the possibility of such an analysis is not a feature, but a necessity.
Yes, and endure on your favorite tablet, tearing one megabit, when you can take a couple of steps around the room to five stripes ... in order to know where to step, analysis is needed.
The stability of the connection depends on many hard-to-calculate factors: the relative position of the devices, the influence of close frequencies, and even the state of the surface. All this is almost impossible to calculate, but you can see it in real time and choose the frequency and position in which there is a minimum of negative influence. Since its speed depends on the stability of the connection.
There are countless software implementations of analyzers. Both well-known software writers and specialized firms were noted here, some of which, in general, are iron manufacturers, such as the Ubiquiti mentioned above with their AirView. All programs differ slightly in interface and visualization method, they do about the same thing and even the same way.
Some differences are dictated by the purpose of scanning, for example, TamoGraph Site Survey is focused on the placement of WiFi devices by area; InSSIDer - for connection analysis available networks within the allowed ranges; and AirView exists to make life easier for the Ubiquiti tuner in range and beyond. Nevertheless, the most well-known of the entire family is the Wi-Fi analyzer, presented by utilities for Android and Windows devices, because “I'm an android, I need the Internet and an outlet.” The program allows you to find a place where no one and nothing interferes, it is simply mastered and used, while it is sufficient for home use.
Any Analysis is meaningless without a goal. It's such an abstract thought. The purpose of the first example will be to restore the width of the channel between Vasya and Petya. The channel is tuned on Ubiquiti equipment, has only two antennas for simplicity. Finding a drop in speed, Vasya goes to 192.168.1.20 and sees there, say, “transmit ccq 50%”. Swearing at the slow connection, Vasya downloads JAWA and finally he presses the big blue Launch AirView button. From this moment, the analysis actually begins, which, by the way, needs to be allowed to work for 10 minutes to accumulate statistics.

Most analyzers display information in the form of graphs, there are many of them, but usually they duplicate each other to one degree or another. Vasya has three of them - short-term (power) displays changes in the last minutes of work, long-term (power) displays the scale from the moment the scan was started, and long-term (energy).
Having recalculated the peaks on the “Waveform View” graph (long-term graph of power changes), Vasya not only sees that some device has appeared nearby in frequency, but also, by the depth of the blue color, finds out which frequencies the channel can be changed to.
The second task for the example will be the task of finding a wider channel for the android. We launch the Wi-Fi analyzer, look at the channel rating for the point on the “channel rating” tab, and get the numbers of free channels. Somehow the example didn't work. Take, for example, the task of finding a more powerful point signal. We start the Wi-Fi analyzer, turn on the meter and see how the readings change when we walk around the room, by the way, if we link the device data to coordinates in the process, we will get a coverage map.
A portable device used in a difficult radio environment must have the means to analyze the surrounding lawlessness, it is simply a must. By typing Wifi analyzer, we get a list of positions for 10, similar functionality and implementation, well, I said - a place for bread.
Having chosen a program that is convenient for you personally, sometimes you don’t understand how you lived before installing it. Assess the network, find the optimal location, and due to the size of the wifi wave, the connection depends on the position and orientation of the device. Yes, in the end, the choice of a connection point from among the possible ones is also an analysis hardwired into the phone's carrier.
All thoughts about a portable device are valid, only in the store the choice is smaller, the prices are higher, although there is a Wi-Fi analyzer and it is even also free. On the Internet, there is InSSIDer and many, many others. The TamoGraph Site Survey mentioned above is also from this sandbox.
Having Wi-Fi on board, you should also have its analyzer. The elders say that even if they remove it for the sake of free space, they still have to install it again and again.
Do not pin your hopes, this is just a utility for “look with your eyes”, by seeing and correcting the channel frequency, the position of the device and the antenna, you can have a more stable contact at a higher torrent speed, especially if you move the welder away from the antenna.
WiFi Guard is an indispensable utility for all enthusiasts with a small wireless network who want to secure it.…
WiFi Crack is a program for forgetful users or novice crackers. Allows easy and simple brute force…
For the Android platform, there are several more reliable applications that have a good reputation in the Google store, among them:
The functionality of all the above software is quite similar, so you have the opportunity to download and test each program individually, and then choose the most suitable one for yourself.
In addition to the classic WiFi Analyzer, there are plenty of good applications for both computers and mobile devices. For example, for Android, an open platform analyzer should be allocated, which is available for download in Play market and is called WiFiAnalyzer (open-source) by VREM Software Development. It is a reliable tool compatible with all OS versions up to Android 6.0 Marshmallow.
For devices from the company Apple will do an application called Network Info II, which is able to display all the information about nearby networks on your screen. It is very easy to use due to the well thought out user interface. The Fing application can also be very useful, thanks to which you will find out complete information about the devices connected to your access point.
Among the applications for desktop solutions, the highly popular Acrylic WiFi Home software deserves special attention. Unlike other programs, this one works not only with versions of Windows that support Metro. Rich functionality, a multi-frequency scanner and a user-friendly interface are available to you completely free of charge.
The analyzer works very, very simply. For example, the WiFiAnalyzer application for Windows is enough to install and run, after which you will receive complete information about the network. The first and main tab displays the connection to the current network and its status, as well as the signal quality in percent and -dBm. For example, 80% is a fairly good indicator, but it can also be improved, about which the program will definitely warn you in the "Analysis" tab.
Below you can select a frequency of 2.4 or 5.0 Ghz, as well as see recommendations on how to improve the signal. Analyzer in automatic mode scans the load of channels and offers you to switch to the freest one, which will increase the quality of your Internet connection. In the "Networks" tab, you will see all the access points available for connection and the signal level in order to choose the most promising option. Even if you are satisfied with the speed and quality of the Internet, it is still recommended to use analyzers sometimes, especially if you play online games, surf the net or watch streaming video.
Networks. It is possible that someone has accessed your Wi-Fi network and is consuming data without your knowledge. How to define it? Recourse to special software.
The software will show a list of devices that are accessing the Wi-Fi network. Whether it's a mobile device, laptop or PC, you'll be aware when an unknown device connects to your Wi-Fi network. Unfortunately, it is not possible to disconnect a device connected in this way, but you can manually change network password in the router settings.
The software shows notifications right on your desktop in real time when an unknown device connects to your Wi-Fi network. In addition, detailed information about a specific device is provided, including the last known IP address of the device, MAC address, date and time when the device was first discovered, digital signature when the device was last discovered, currently connected or not, network card name (if applicable), etc.
Apart from this, you will see a list of all detected devices and check which device is currently connected or not. Known device can mark it as "known". Setting Set IP ranges and scan frequencies is also available in this software.
The ability to block a specific device is available, but in a paid version.
The installation file of this program is 2.32 MB.

Wireless Network Watcher is a portable software for detecting intruders on your Wi-Fi network. D For the connected device it turns out almost the same information as in the software mentioned above.
Apart from this information, it is possible to export the list to a text file, HTML file or CSV file for later use. You can put this program in your system tray and it will constantly scan in the background.
The first time you launch the program, you will be prompted to install a network adapter and change the range (if necessary) of the IP address in order to start the scanning process.
Size setup file 292KB.

SoftPerfect WiFi Guard is also very useful for automatically and regularly scanning networks for rogue devices. You can set the network scan time automatically within the range of 1 to 60 minutes. You can set your own IP ranges and audio file to play when an unknown device is detected.
After the scan is completed, a pop-up window appears that displays the IP address and MAC address of unknown devices. In addition, all connected devices are visible. For each individual device, the provider name, RTT (Round-Trip Time), device name, IP address, MAC address and other information are shown.
The installation file is about 2 MB. When starting for the first time, you need to select network adapter, and configure scan settings.

NCS Network Scanner is a very simple software that does not require any settings to detect devices connected to Wi-Fi. When you run the program, you can start scanning with one click of the mouse, the program will find devices connected to the network. It does not show detailed information for the device. Just the hostname, IP address, response time, and reason for the break.
This software is useful for novice users. Displays a list of connected devices for a specific time. There is no way to save the list to PC.
ZIP file 2.08 MB.

One of the easily customizable programs. Unfortunately, she is unable to detect mobile devices associated with your PC, which is a significant disadvantage of this software.
Devices are scanned based on the range selected by the user. As a result, you can see the IP address working group, computer name, MAC address, adapter manufacturer, and the main browser used by this device. You can export the list to a CSV file, a text file, an XML file, or an HTML file.
The size of the installation file is 278 KB. When you run it for the first time, it will prompt you to set the IP address range and scan speed. After that, the scan will start.
The first three programs in this list are the most effective in discovering all devices connected to a Wi-Fi network. Although you can use the router's Wi-Fi administrative console to check the list of devices, this takes some time. The listed software is easy to set up and shows detailed information about the connected devices.
Leave your feedback:
A router today is in almost every home. But such an abundance of Wi-Fi routers could not but affect the quality of the signal. Very often, networks overlap one another and there are interruptions in the Internet signal.. And this despite the fact that he is strong and nothing visible should interfere with him.

The reason just may be the imposition of several access points on one channel. For apartment buildings, this problem is especially relevant. Only the user needs to distinguish between signal and router problems. So very often they confuse the complete freezing of the smartphone on Android platform at the stage of downloading torrent files. Here the reason is different.
Wi-Fi breaks can proceed as follows:
The reason for all these troubles is precisely the use of the same communication channel by many points of wireless routers. In the future, the congestion of this channel leads to low speed and disconnections.
To quickly solve the problem means to change the channel. Most users do not even know how to analyze such a situation and how to change the "Auto" setting on their router.
You can read about how to change the communication channel on different types of routers at this link.
Changing the automatic selection of a network channel on an Asus router
Analyze the status of the wireless network will help free programs, which can be downloaded without problems on the Internet for:
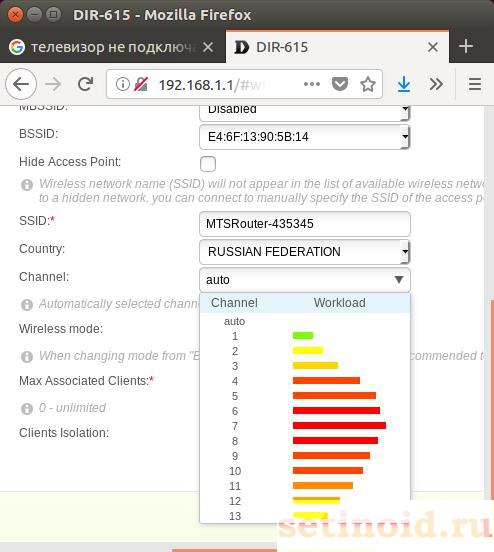
There are thirteen channels in total for signal transmission in Russia. So, of these 13 channels, the first, sixth and eleventh do not intersect. But not all countries use 13, in the USA, for example, only 12 are allowed. different versions The operating system has its own peculiarities in the use of certain channels.
Schematic display of overlapping channels
So Windows 10 does not see channel 13, and in the router settings it is impossible to change the region to Europe in order to fix access to this channel.
OS version 7 also does not see channels greater than 12. Therefore, when choosing another unloaded channel, this must be taken into account.
Just programs - analyzers are needed in order to identify free channels, configure the router for them and work calmly.
If the user has a problem connecting to any channel or lags the signal due to channel congestion, then you can ask the technical support of the official Windows website for answers to your questions.
The most convenient and simple programs analyzers of occupancy of communication channels are the following:
These programs will help you learn more useful information about networks. You can recognize the type of security, signal speed. Convenient graphs help analyze the signal. The figure below shows how different users overlap on the channels and which access point has the highest frequency signal.
Wireless network channel analysis with overlay graphs
When downloading the program from the official site, the user should pay attention to the terms of use. Very often today they offer only demo versions of programs with a period of use of no more than a month. After that, the program must be purchased.
Channel occupancy analysis
As you can see from the picture, after the analysis it is clearly seen that the most crowded channel is 6. That is, you should disconnect from it and select free 2, 3, or 4, or any other except the first and eleventh, which are also already occupied.
Best for smartphone on the Android platform, use the Wi-Fi Analyzer program. No problems with searching and downloading. The user logs into the Google service Play and through the search finds this application and downloads it. When the smartphone is turned on, you can also download the application via a PC.
Downloading the program from Google Play
After installation, you can go into the program and analyze the communication channels. You will immediately see at what frequency the router is operating, and on what channel. All this will be indicated on the available charts. It is enough to select in the settings - channels and properties.
Asta operates at a frequency of 50 and the signal is received on channels 8-10
That is, in an illustrative example, nothing needs to be changed, because the signal does not intersect with almost anyone. In the same program, you can select the "channels" tab in the properties and see which channel has the highest and best signal. The rating is indicated by asterisks.
The example shows that the best signal without interference is on channels 12, 13 and 14. The program is quickly installed and quickly erased. Therefore, users should not be afraid that the application will take up a lot of memory on the device.
There is another handy tab in the same application that will show the frequency of the signal. With such a pointer, you can move around the apartment and choose exactly the place where the signal will be the strongest.
Signal strength indicator
There are a lot of routers on the market today. But according to statistics, the D-Link model is the most frequently purchased. How can I remove the auto-selection of the channel on it?
To do this, we type in address bar the Internet address 192.168.0.1. In the window that opens, type admin in both login and password. Unless the user himself changed them. Standard login and password are always written on back cover router boxes.
Changing Wireless Network Settings
A window appears, "advanced settings" are selected in it, and then the main ones, as in the figure above. After selecting the basic properties of the wireless network, you should find the "channel" line in the window that appears and select the free channel in it that was shown by any program for analyzing communication channels.
Selecting and saving a new communication channel
After that, the connection may be interrupted for a short time and restarted again. If this does not happen, you need to check the router settings again and if a dialog box appears in the upper right corner asking you to save the changes, you need to click and save it. After that, the data transfer and download speed should increase.
With the help of such simple manipulations, any user can today correct small errors in the operation of the wireless network in his apartment without calling the masters and without paying for their services.
So, how to choose this very high-speed and high-frequency wireless communication channel?
Thus, fixing problems with a lost signal and lost speed turned out to be very simple, you just need to clearly follow the above steps.


